Kinematics Exam1 and Problem Solutions
1. Velocity vs. time graph of an object traveling along a straight line given below.
 a) Draw the acceleration vs. time graph,
b) Draw the position vs. time graph of the object.
a) Slope of the velocity vs. time graph gives us acceleration. In first interval, slope of the line is constant and negative, thus, acceleration of the object is also constant and negative. In other words, object does slowing down motion in positive direction with negative acceleration.
Slope=(0-v)/t=-a
In the second interval, slope is constant and positive, so acceleration is also constant and positive. Object does speeding up motion in positive direction.
Slope=(v-0)/t=+a
 b) In the first and second interval velocity of the object changes constantly thus; position time graph becomes like in the picture given below.
 2. An object is stationary at t=0. Picture given below shows the acceleration vs. time graph of this object. Find the intervals in which object speeds up in positive direction.
 Area under the acceleration vs. time graph gives us the change in velocity.
I. In this interval, acceleration is increasing with the time, thus object speeds up with increasing acceleration.
II. In this interval, acceleration of the object is constant, so object speeds up constantly.
III. In this interval, acceleration of the object is decreasing with the time, so object speeds up with decreasing acceleration.
In all intervals, velocity of the object increases.
3. An object is stationary at t=0. Picture given below shows the acceleration vs. time graph of this object. Find the intervals in which object speeds up in positive direction.
 I. Object speeds up with increasing acceleration in negative direction.
II. Object speeds up with constant acceleration in negative direction.
III. In this interval, object slows down with constant acceleration. (acceleration (+), velocity (-))
4. Two car A and B are at the same point at t=0. B travels with constant velocity and A travels with constant acceleration. Their velocity vs. time graph is given below. After how many meters they become together.
 They have to take same distances to become together. Thus, using the graph given below we find distance they take. Area under the velocity vs. time graph gives us distance taken by the cars. We say that they become together after t s. Thus, we draw following graph in which blue lines show distance taken by car A and red lines show distance taken by car Y.
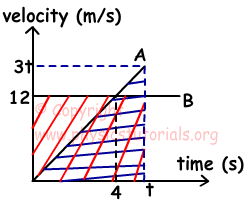 ax=12/4=3m/s²
Ax=Bx
3t.t/2=12.t
3t=24
t=8s
Bx=12.8=96m
5. Position vs. time graph of a car is given below. In which intervals direction of velocity and direction of acceleration are same.
 We draw velocity vs. time graph using position time graph.
 Slope of the velocity vs. time graph gives us acceleration.
 In the first interval, directions of velocity and acceleration are same.